title: “Consonant Frequency Animation with Manim” format: revealjs editor: visual —
Introduction
This presentation walks through the process of building an animation that:
- Analyzes consonant frequency in a text passage
- Shows the progressive counting of consonants
- Animates a bubble sort of the final histogram
Why is this relevant?
Animating code, especially for data processing and algorithm visualization, provides significant practical benefits:
- Education: Helps learners visually understand abstract concepts and algorithm steps.
- Debugging & Communication: Makes it easier to spot logical errors or inefficiencies in code, and to explain processes to others.
- Engagement: Turns data analysis into an interactive and compelling experience.
Text Passage to Analyze
We’ll use the following text as the input for our analysis:
“Omni Analytics Group specializes in advanced data science and artificial intelligence solutions. Our team leverages statistical modeling, machine learning, and data visualization to drive actionable insights for clients across a variety of industries.”
This text will be processed to count the frequency of each consonant character.
Project Setup
from manim import *
from collections import defaultdictmanim: Provides all animation capabilitiesdefaultdict: Helps track consonant counts efficiently
This code belongs at the top of your Python file.
Scene Class Definition
class ConsonantHistogram(Scene):
    def construct(self):
...Scene: Base class for all Manim animationsconstruct(): Mandatory method where the animation is built
This is the framework for our entire animation.
Text Input and Consonant Definition
phrase = ("Omni Analytics Group specializes in advanced data science and artificial intelligence solutions. "
          "Our team leverages statistical modeling, machine learning, and data visualization to drive actionable "
          "insights for clients across a variety of industries.")
consonants = 'bcdfghjklmnpqrstvwxyzBCDFGHJKLMNPQRSTVWXYZ'phrase: The text to analyze (can be any string)consonants: All consonant characters we’ll count (both cases)
This defines our data source and what characters to track.
Progressive Counting Mechanism
consonant_counts = defaultdict(int)
consonant_progression = []

for i, char in enumerate(phrase):
    if char in consonants:
        consonant_counts[char] += 1

    if i % 10 == 0 or i == len(phrase) - 1:
consonant_progression.append(dict(consonant_counts))defaultdict: Automatically initializes counts to 0enumerate: Tracks character position in texti % 10: Takes snapshots every 10 characters
Stores progressive counts in consonant_progression.
Histogram Creation Function
def create_histogram(counts):
    bars = []
    max_count = max(counts.values()) if counts else 1
    x_offset = -6
    bar_width = 0.8
colors = [BLUE, GREEN, YELLOW, PURPLE, ORANGE, TEAL]max_count: Normalizes bar heightsx_offset: Starting x-position for first barcolors: Color cycle for distinct bars
This function will be called for each progression step.
Bar Construction
for idx, (letter, count) in enumerate(sorted(counts.items())):
    bar_height = count / max_count * 4
    color = colors[idx % len(colors)]
    bar = Rectangle(
        width=bar_width,
        height=bar_height,
        fill_color=color,
        fill_opacity=0.7,
        stroke_width=1
    ).move_to([x_offset, -2 + bar_height / 2, 0])
# ^ Replace .set_x and .set_y with .move_to for 3D coordinatesRectangle: Manim shape for histogram barsmove_to: Correctly positions bars (replace deprecated.set_xand.set_y)fill_opacity: Makes bars semi-transparent
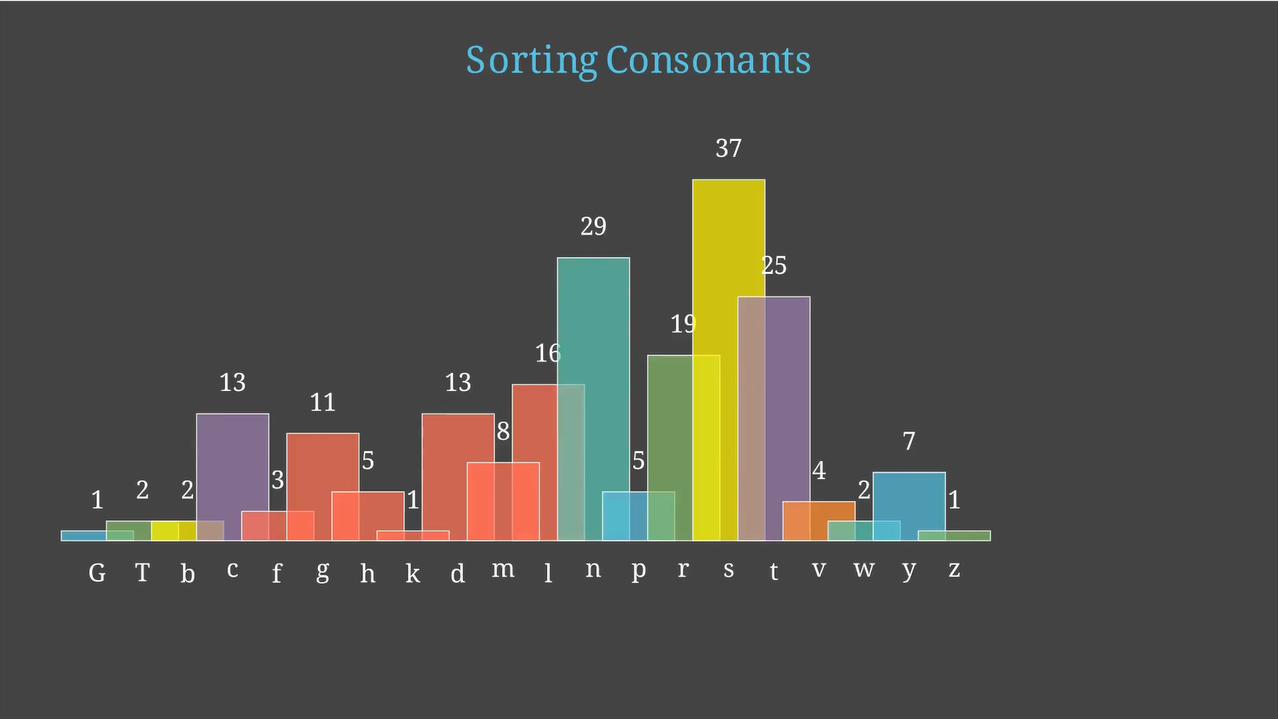
Adding Labels
letter_text = Text(letter, font_size=20).next_to(bar, DOWN)
count_text = Text(str(count), font_size=20).next_to(bar, UP)
bar_group = VGroup(bar, letter_text, count_text)
bars.append((bar_group, bar, letter, count))
x_offset += 0.5Text: Adds consonant character below bar, and count above barVGroup: Combines elements for easy animationx_offset: Spaces bars evenly
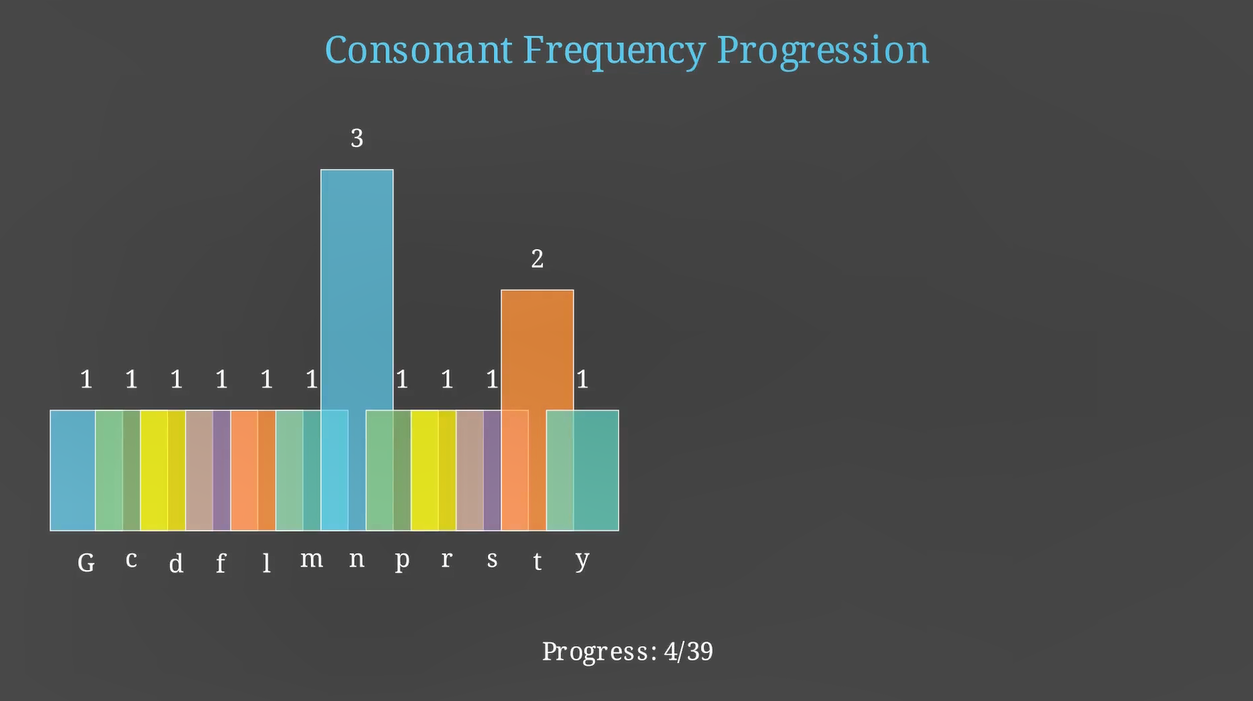
Animation Sequence
title = Text("Consonant Frequency Progression", font_size=30, color=BLUE).to_edge(UP)
self.play(Write(title))

progress_text = None
for i, counts in enumerate(consonant_progression):
    if i > 0:
        self.play(FadeOut(current_histogram))

    bars = create_histogram(counts)
    current_histogram = VGroup(*[bar_group[0] for bar_group in bars])
self.play(Create(current_histogram))Write(title): Animates title appearanceFadeOut: Clears previous histogramCreate: Animates new histogram
Loops through each progression snapshot.
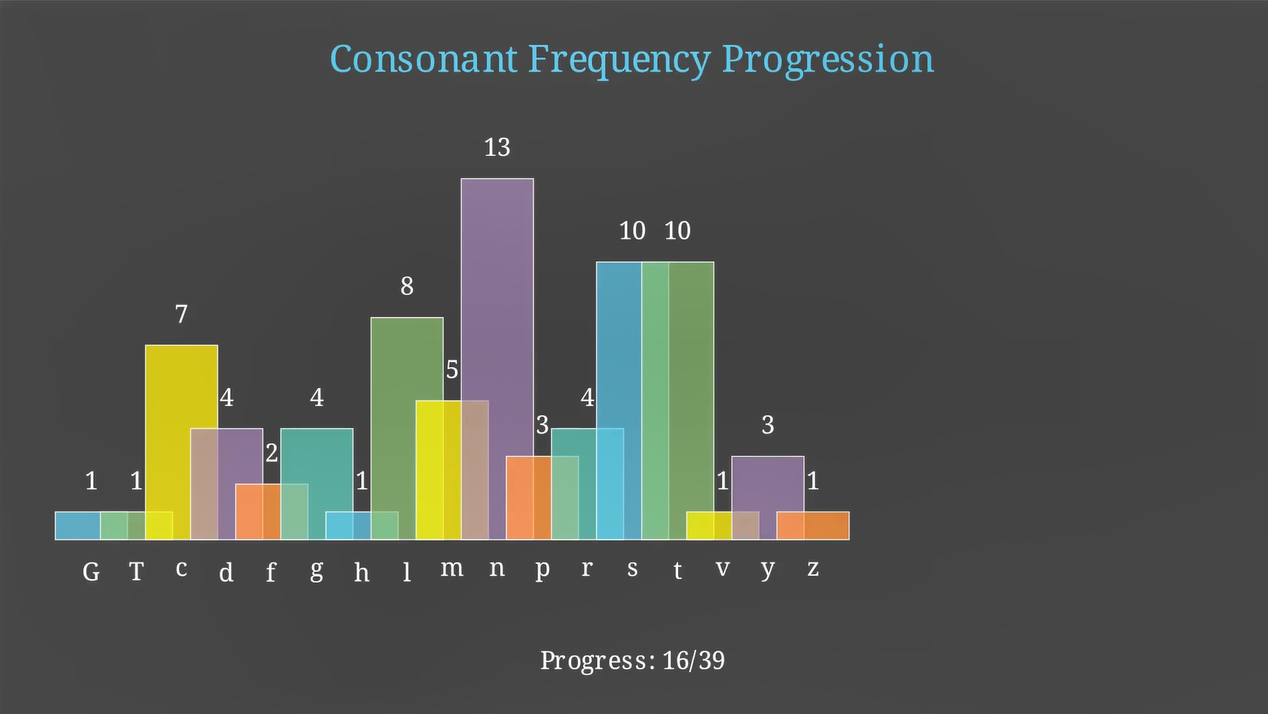
Progress Tracking
progress_text = Text(f"Progress: {i+1}/{len(consonant_progression)}",
                     font_size=20).to_edge(DOWN)
if i > 0:
    self.play(ReplacementTransform(prev_progress, progress_text))
else:
    self.play(Write(progress_text))
prev_progress = progress_text
self.wait(0.2)- Shows current/total progression steps
ReplacementTransform: Smoothly updates counterwait(0.2): Pause between steps

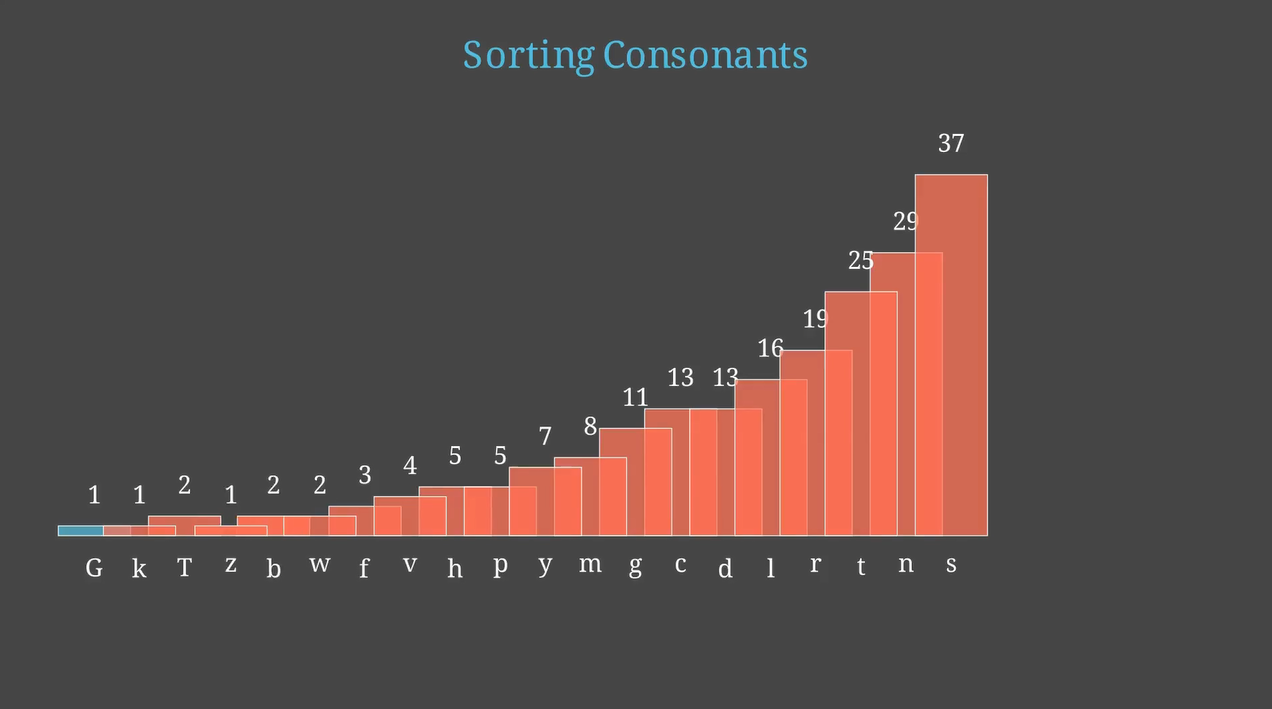
Transition to Sorting
self.play(FadeOut(progress_text))
self.play(FadeOut(title))
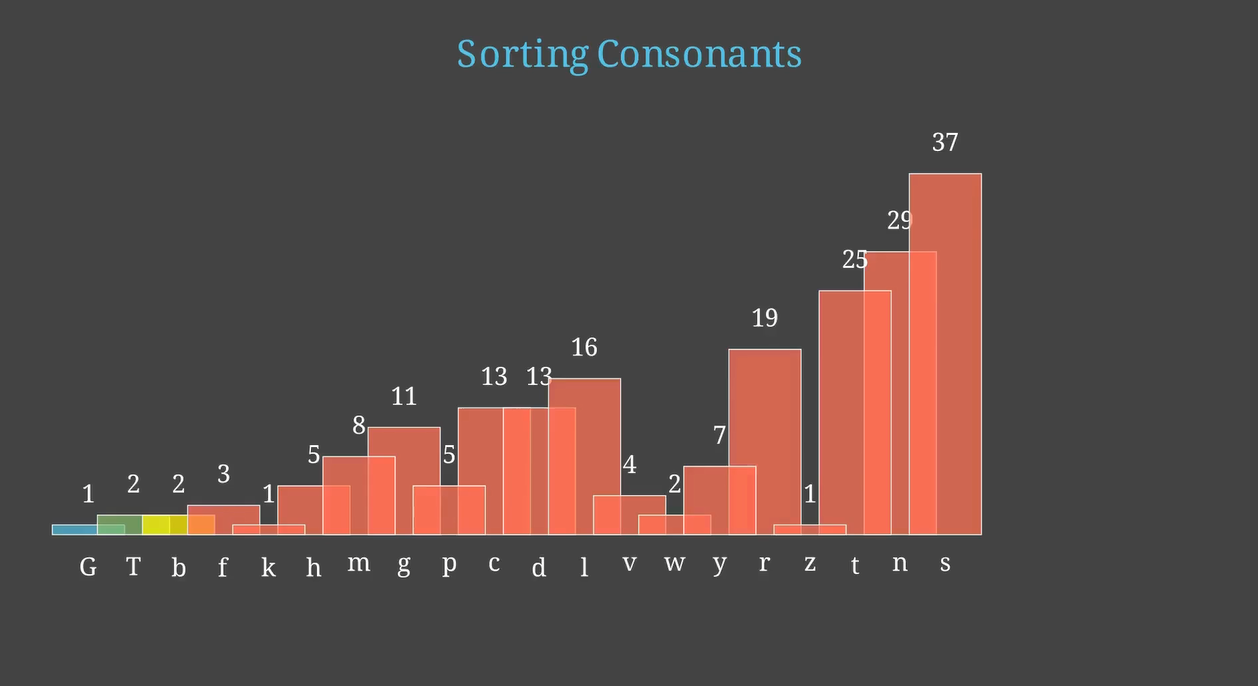
title_sorting = Text("Sorting Consonants", font_size=30, color=BLUE).to_edge(UP)
self.play(Write(title_sorting))- Clears previous UI elements
- Introduces new phase with a different title
- Provides clear visual transition
![]()
Bubble Sort Implementation
for i in range(len(bars)):
    for j in range(len(bars) - 1 - i):
        bar1, bar2 = bars[j], bars[j + 1]

        if bar1[3] > bar2[3]:
            self.play(
                bar1[1].animate.set_fill(RED, opacity=0.9),
                bar2[1].animate.set_fill(RED, opacity=0.9),
                run_time=0.2
)- Classic bubble sort algorithm
set_fill(RED): Highlights compared barsrun_time: Controls animation speed
Bar Swapping Animation
self.play(
    bar1[0].animate.shift(0.5 * RIGHT),
    bar2[0].animate.shift(-0.5 * LEFT),
    run_time=0.2
)
bars[j], bars[j + 1] = bars[j + 1], bars[j]
self.play(
    bar1[1].animate.set_fill(bar1[1].fill_color, opacity=0.7),
    bar2[1].animate.set_fill(bar2[1].fill_color, opacity=0.7),
    run_time=0.2
)shift(): Moves bars horizontallyanimate: Manim’s interpolation system- Resets colors after swap
- Updates list order
Final Result
The complete animation shows:
- Progressive counting of consonants
- Animated histogram building
- Visual sorting of final frequencies